


Microscopic and spectroscopic methods
Single-molecule localization microscopy
Fluorescence microscopy is a technique to visualize distributions of fluorescently labelled molecules within a sample in a non-invasive and specific way and is also compatible with complex biological systems like cells or tissues. However, the resolution is limited by the diffraction limit of light to about 200 nm in the lateral imaging plane and to >500 nm in the axial plane. In the past years, a variety of super-resolution techniques were developed circumventing the diffraction limit.
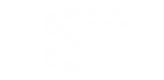
Single-molecule localization microscopy (SMLM) bypasses the lateral resolution limit by separation of fluorescence emission of fluorophores closer than the diffraction limit in time and their accurate localization (figure 1). For this purpose, photoactivatable or photoswitchable fluorophores are used, thus enabling the reconstruction of high-resolution images (figure 2). Typically, SMLM experiments are either performed in a wide-field configuration, or in total internal reflection (TIR). The advantage of TIR fluorescence microscopy is that the excitation of fluorophores is restricted to about 100 nm along the axial plane and thus reduces the observed axial depth. Two concepts that rely on photoswitching or photoactivation are direct stochastic optical reconstruction microscopy (dSTORM) and photoactivated localization microscopy (PALM).
As mentioned before, the key of SMLM is to optically modulate fluorescence emission and thus to limit the number of fluorophores detected at a given time to the single-molecule level. In the dSTORM approach, this is achieved by operating conventional synthetic fluorophores (i.e. commercially available, for example as antibody conjugates) as photoswitches in the presence of reducing buffers. dSTORM exploits the fact that most fluorophores are prone to reduction through suitable reagents that have a matching redox potential, and by that transit into a long-lived, non-fluorescent radical or other reduced state. The transition into this “dark” state is governed by the excitation light, the reducing potential of the buffer reagents (typically thiols such as mercaptoethylamine) and the intensity of the excitation light. The back-transition into the “bright” state is governed by residual oxygen, the thermal stability of the off-state and the intensity of a second wavelength (typically blue-shifted to about 100 nm to the excitation light). The dSTORM concept allows reversible photoswitching of many synthetic fluorophores; prominent examples are Alexa Fluor® 647, Alexa Fluor® 532, ATTO 655 and many others.
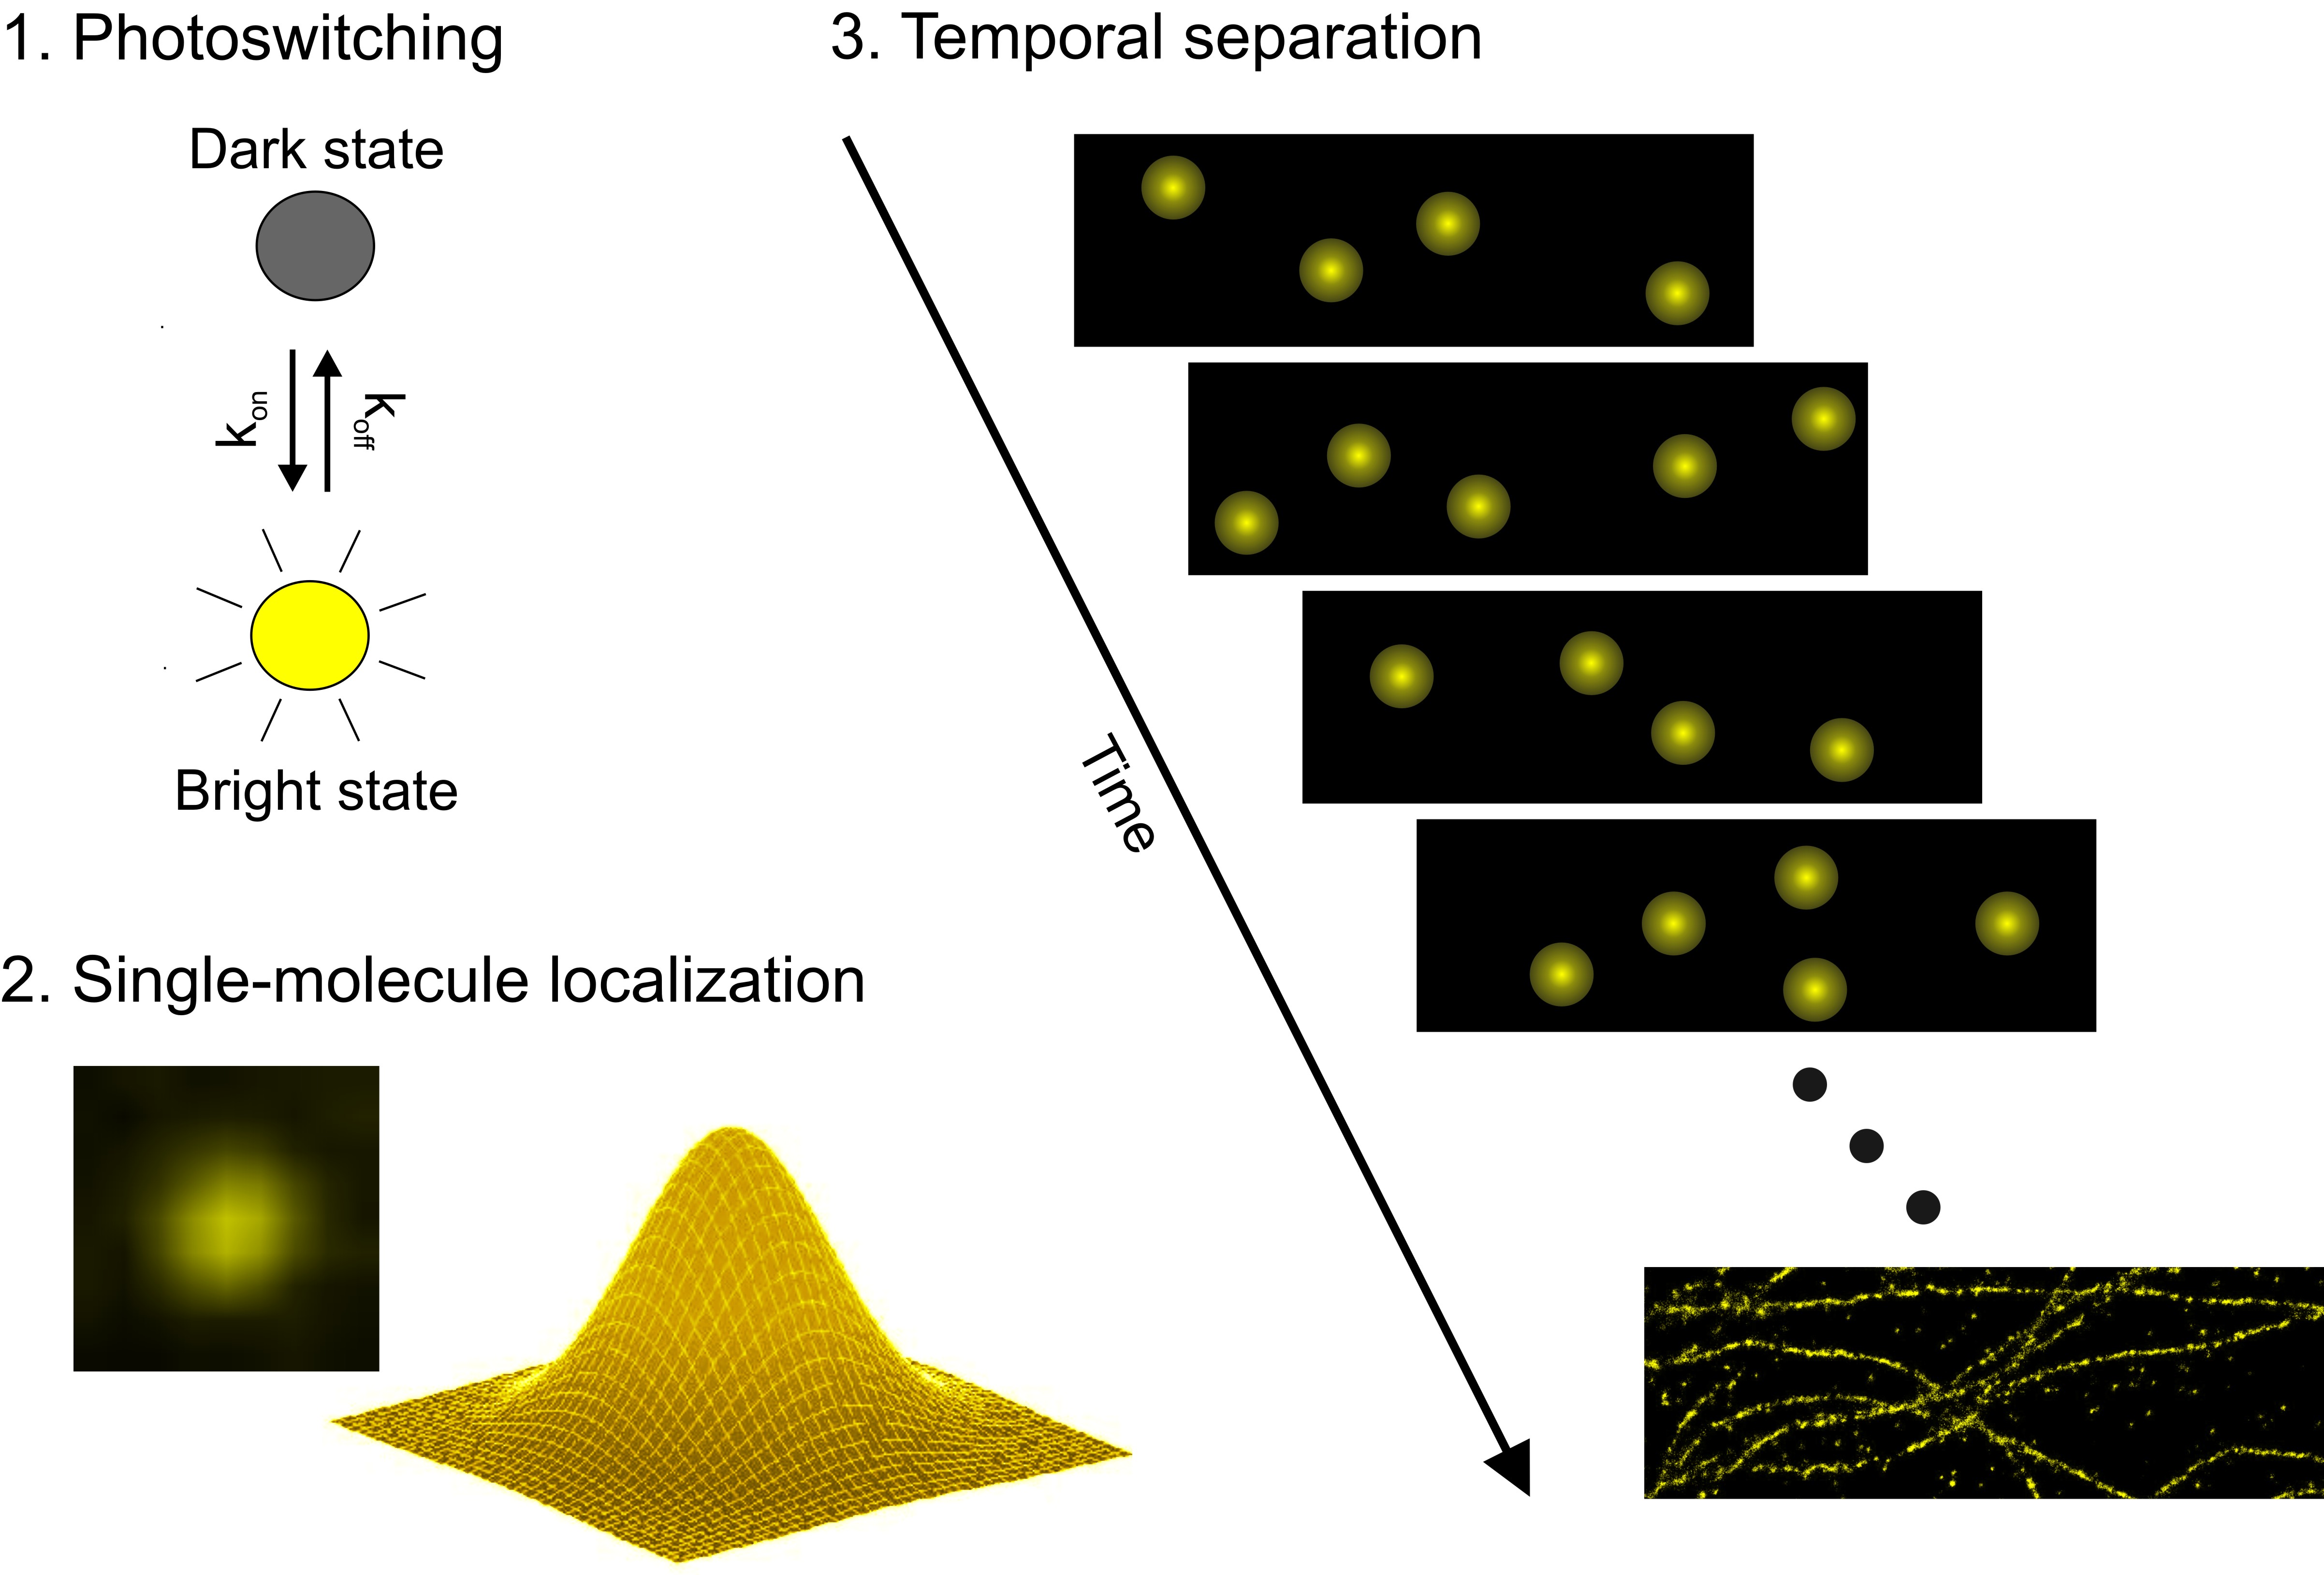
Figure 1: Principle of dSTORM. Switching fluorophores between a dark and a bright state enables temporal separation of nearby fluorophores. Fitting of point-spread functions of single emitters allows accurate position determination. Super-resolution images can then be reconstructed.
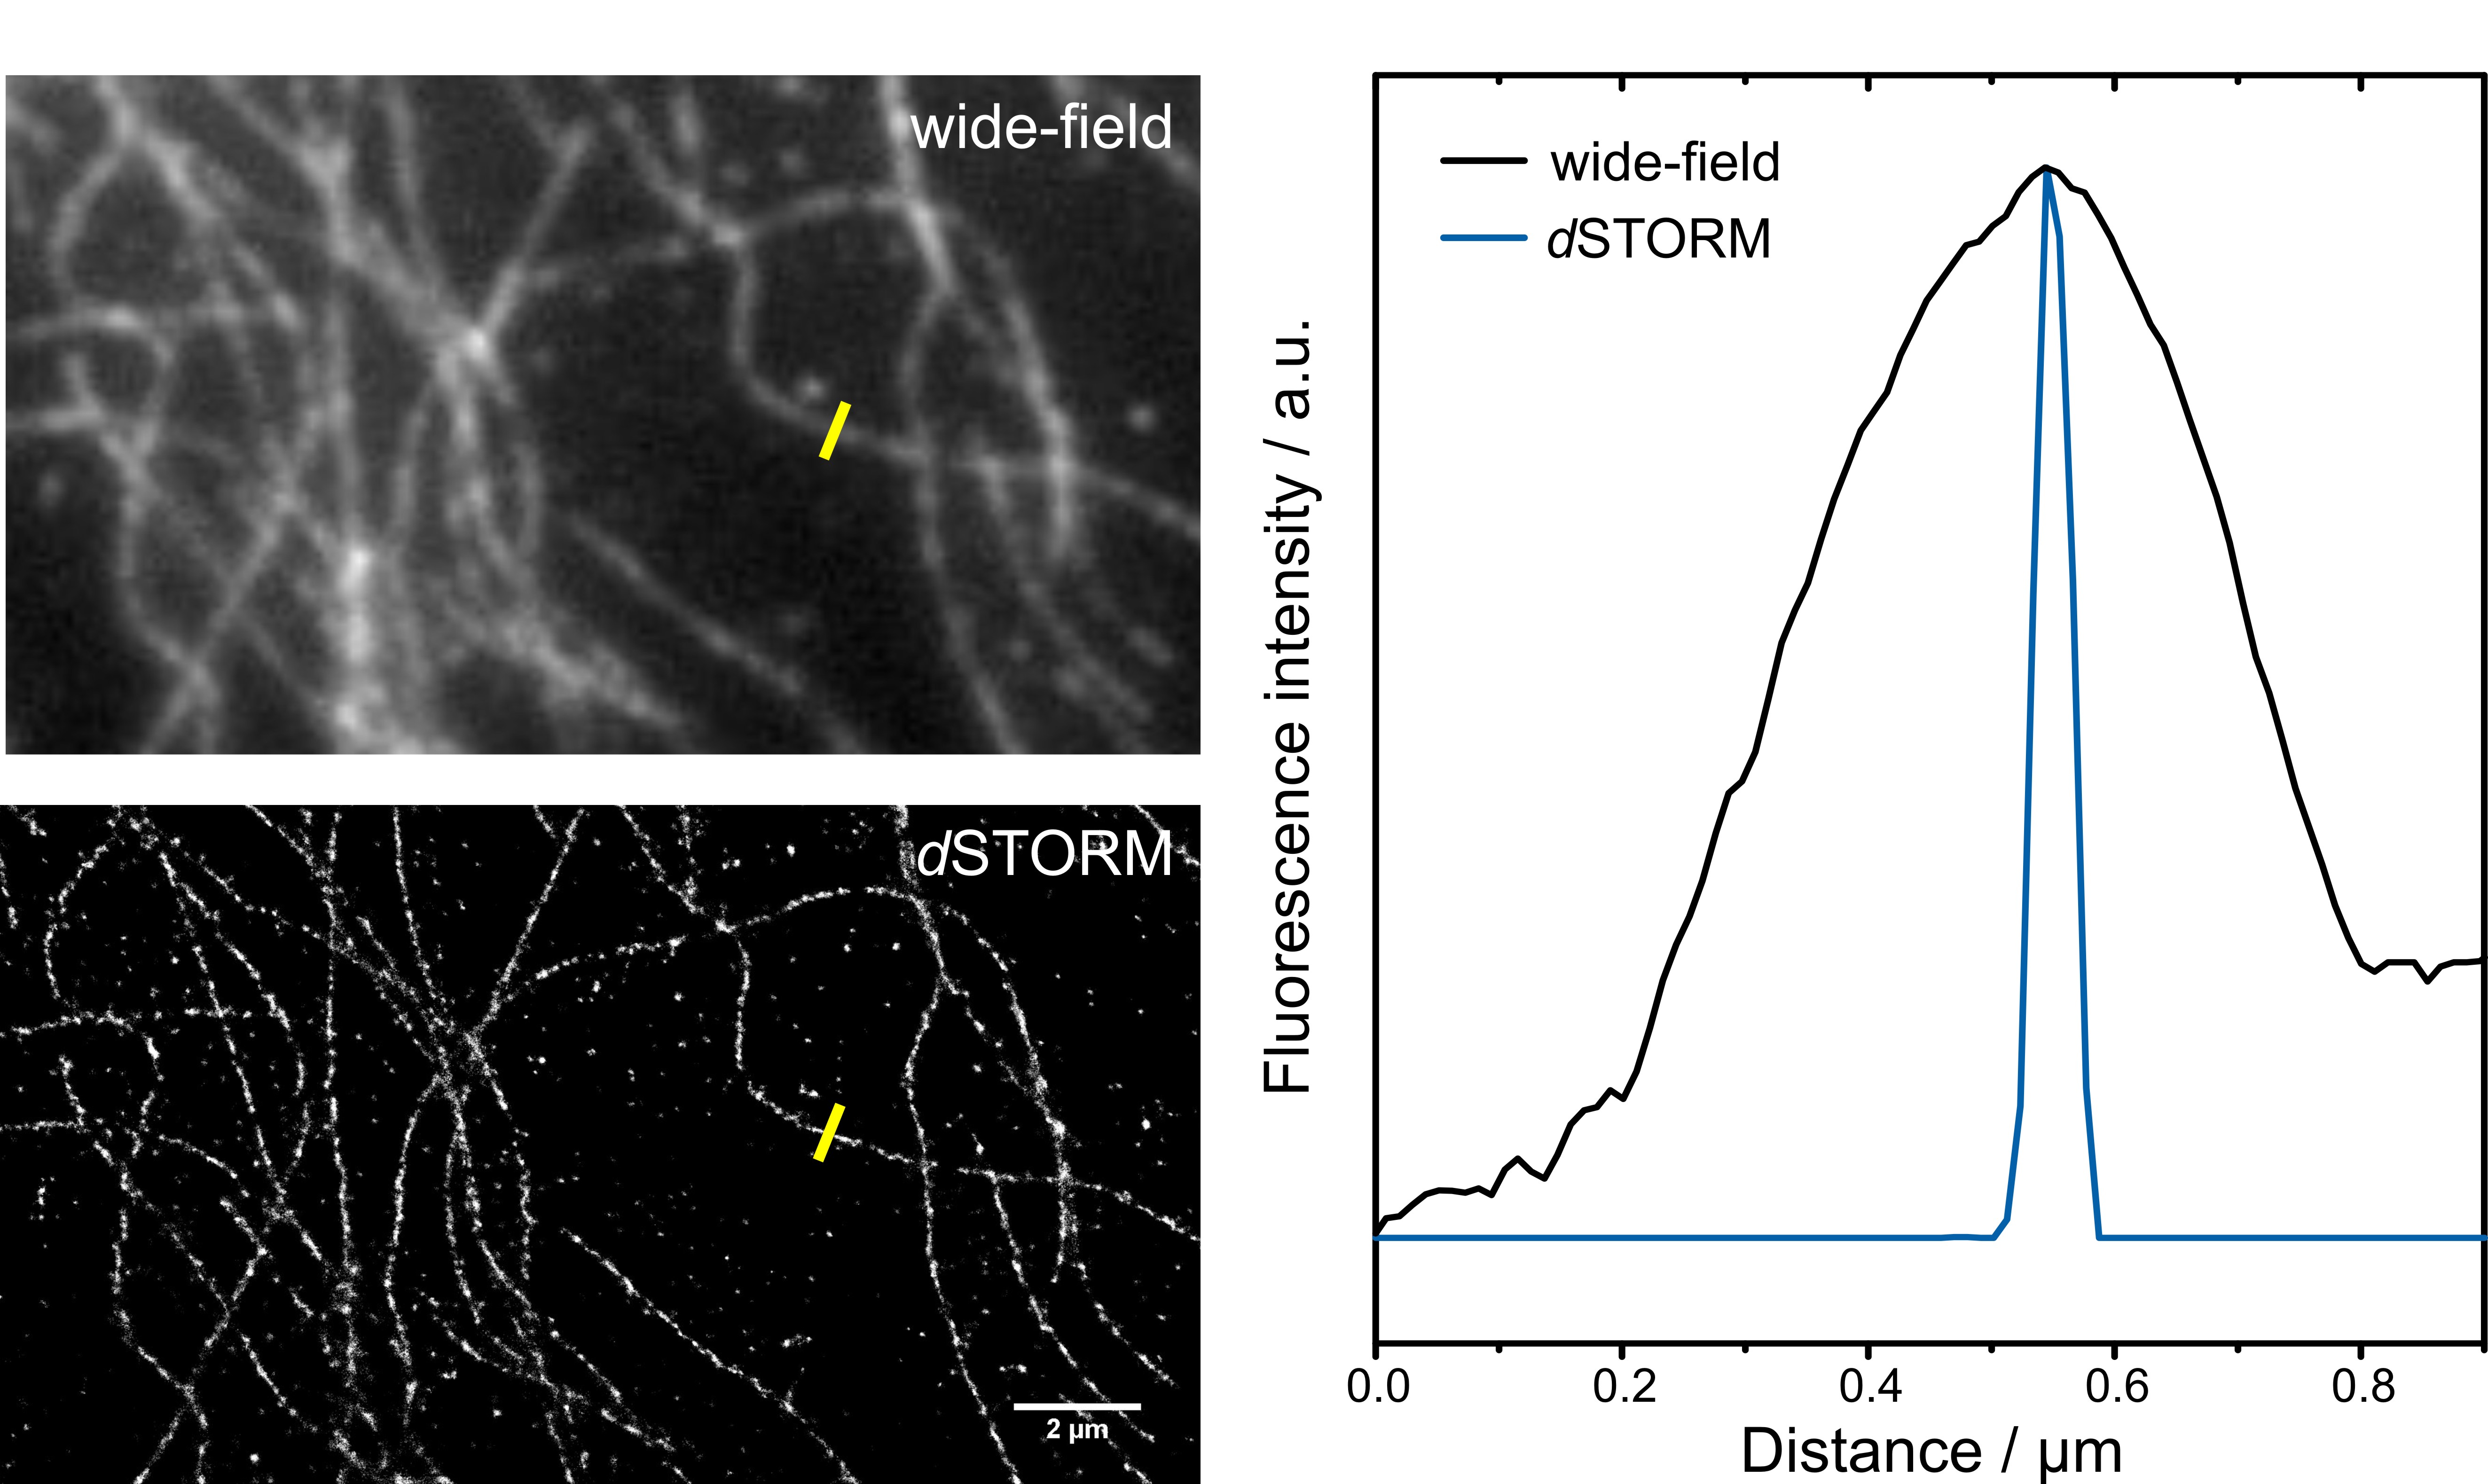
Figure 2: Resolution enhancement in super-resolution microscopy. Wide-field and dSTORM image of beta tubulin labeled with Alexa Fluor® 647 (left). Intensity profiles of the highlighted tubulin filament show the resolution improvement with the dSTORM technique (right).
Different to dSTORM, the PALM concept was originally conceived with intrinsically photomodulatable fluorescent proteins, without the need of chemical buffers (and thus suited well for live cell imaging). PALM has the advantage that stoichiometric labeling through co-expression of fluorescent proteins is accessible. The drawback is their lower quantum yield compared to organic dyes, which leads to a lower localization accuracy. Common fluorescent proteins for PALM imaging are mEos, PAmCherry, Dronpa and others.
Single-molecule photobleaching
Knowing the stoichiometries of molecular complexes is important for understanding the biological functionality of proteins. Single-molecule photobleaching enables to elucidate complex stoichiometries. Therefore, fluorescence intensity traces from diffraction-limited fluorescent spots are recorded in TIR mode. As photobleaching is a discrete process, a step-wise decrease of the fluorescence intensity can be observed. Single-step photobleaching corresponds to a single molecule, while two-step photobleaching indicates that two molecules are localized together (within a diffraction-limited area) (figure 3).
Figure 3: Single-molecule photobleaching. The TIRF image of a single-molecule surface of Cy5 molecules shows fluorescent spots of different intensity (left). Observing the intensity traces with time delivers one- and two-step photobleaching corresponding to one or two dye molecules, respectively. Theoretical intensity traces of step-wise photobleaching are shown on the right.
Fluorescence correlation spectroscopy
Fluorescence correlation spectroscopy (FCS) as a long-time established method provides access to diffusion and binding studies. In FCS measurements intensity fluctuations of fluorescent molecules entering and leaving the laser focus are analyzed and result in information on diffusion characteristics.
The experimental FCS setup consists of a laser focused into the sample solution (figure 4). The emission of excited fluorophores in the focal volume passes a pinhole and is detected by sensitive avalanche photodiodes (APDs). The recorded intensity fluctuations are auto- (when using one APD) or cross-correlated (two APDs). The resulting correlation curve can be approximated with different models, and provides information of different kind: (i) the number of molecules in the confocal volume and thereby the concentration; (ii) the diffusion time of the molecules through the laser focus and the related diffusion coefficient (if the confocal volume is known) and (iii) photophysical processes such as triplet or quenching kinetics.

Figure 4: Scheme of a setup for fluorescence correlation spectroscopy (left). The fluorescence intensity fluctuations are measured by two avalanche photodiodes (APDs) (right top) and the signals are cross-correlated resulting in a correlation curve (right bottom).
The dissociation constant of a specific ligand-receptor pair can be determined by titration of the ligand against the labeled receptor or vice versa. The change in diffusion time of the labeled receptor due to ligand binding is observed and the resulting binding curve yields information on the binding affinity (figure 5).
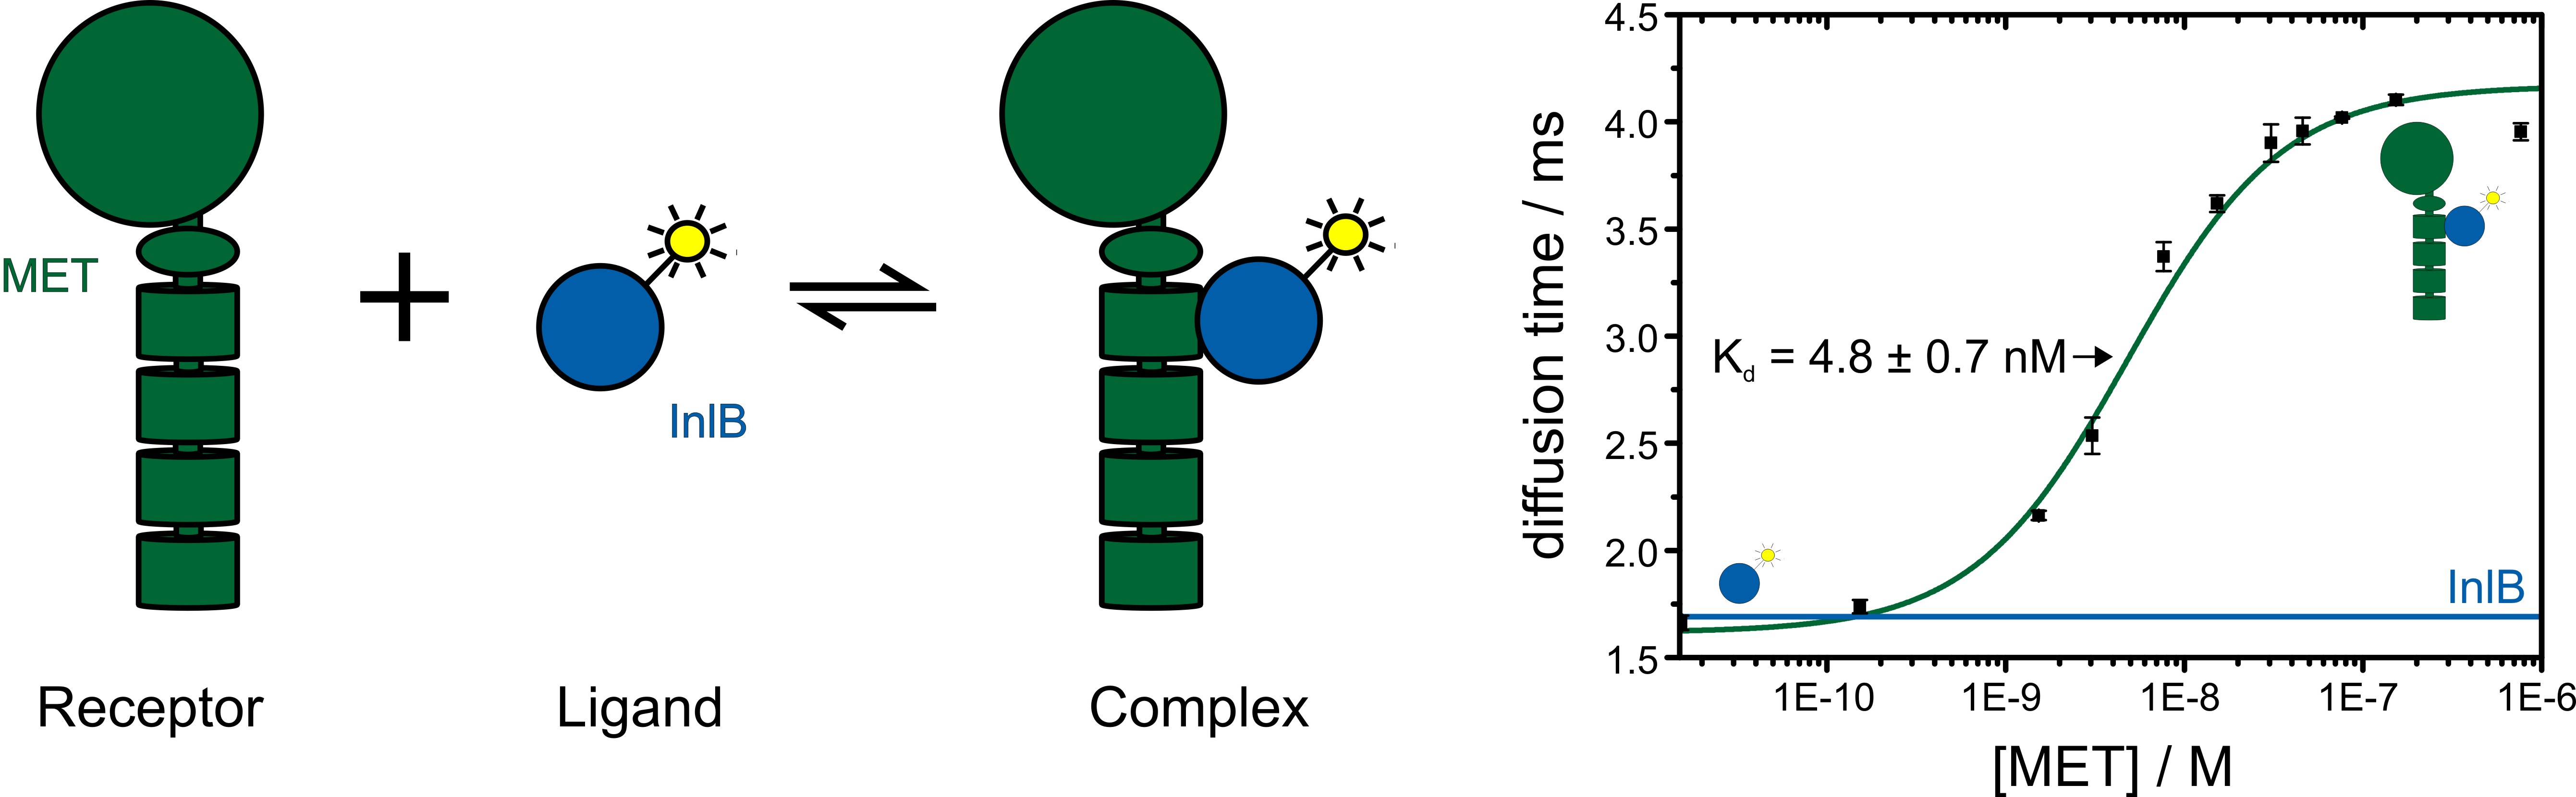
Figure 5: Fluorescence correlation spectroscopy reveals receptor-ligand binding. The receptor is titrated against the fluorophore labeled ligand. With increasing concentration of the receptor-ligand complex the observed diffusion time becomes slower. By plotting the diffusion time against the receptor concentration a binding curve and the dissociation constant Kd of the receptor-ligand pair is determined.
Super-resolution optical fluctuation imaging
Super-resolution optical fluctuation imaging (SOFI) is a technique which achieves a resolution enhancement by exploiting that single emitters fluctuate in their intensity independently from each other over time (figure 6). Fluorescence intensity fluctuations can either be generated using redox buffers (similar to the dSTORM principle), or by using fluorophores that exhibit inherent photoswitching (e.g. quantum dots or photoswitchable fluorescent proteins). An image stack is recorded, and the fluorescence signal is correlated for each individual pixel over time. Only correlated fluctuations (originating from the same fluorophore) contribute a non-zero signal to the final image, leading to a resolution enhancement and background reduction. The resolution enhancement scales with the square root of the order of the cumulant, which is about 1.4-fold for the second-order auto-correlation function.
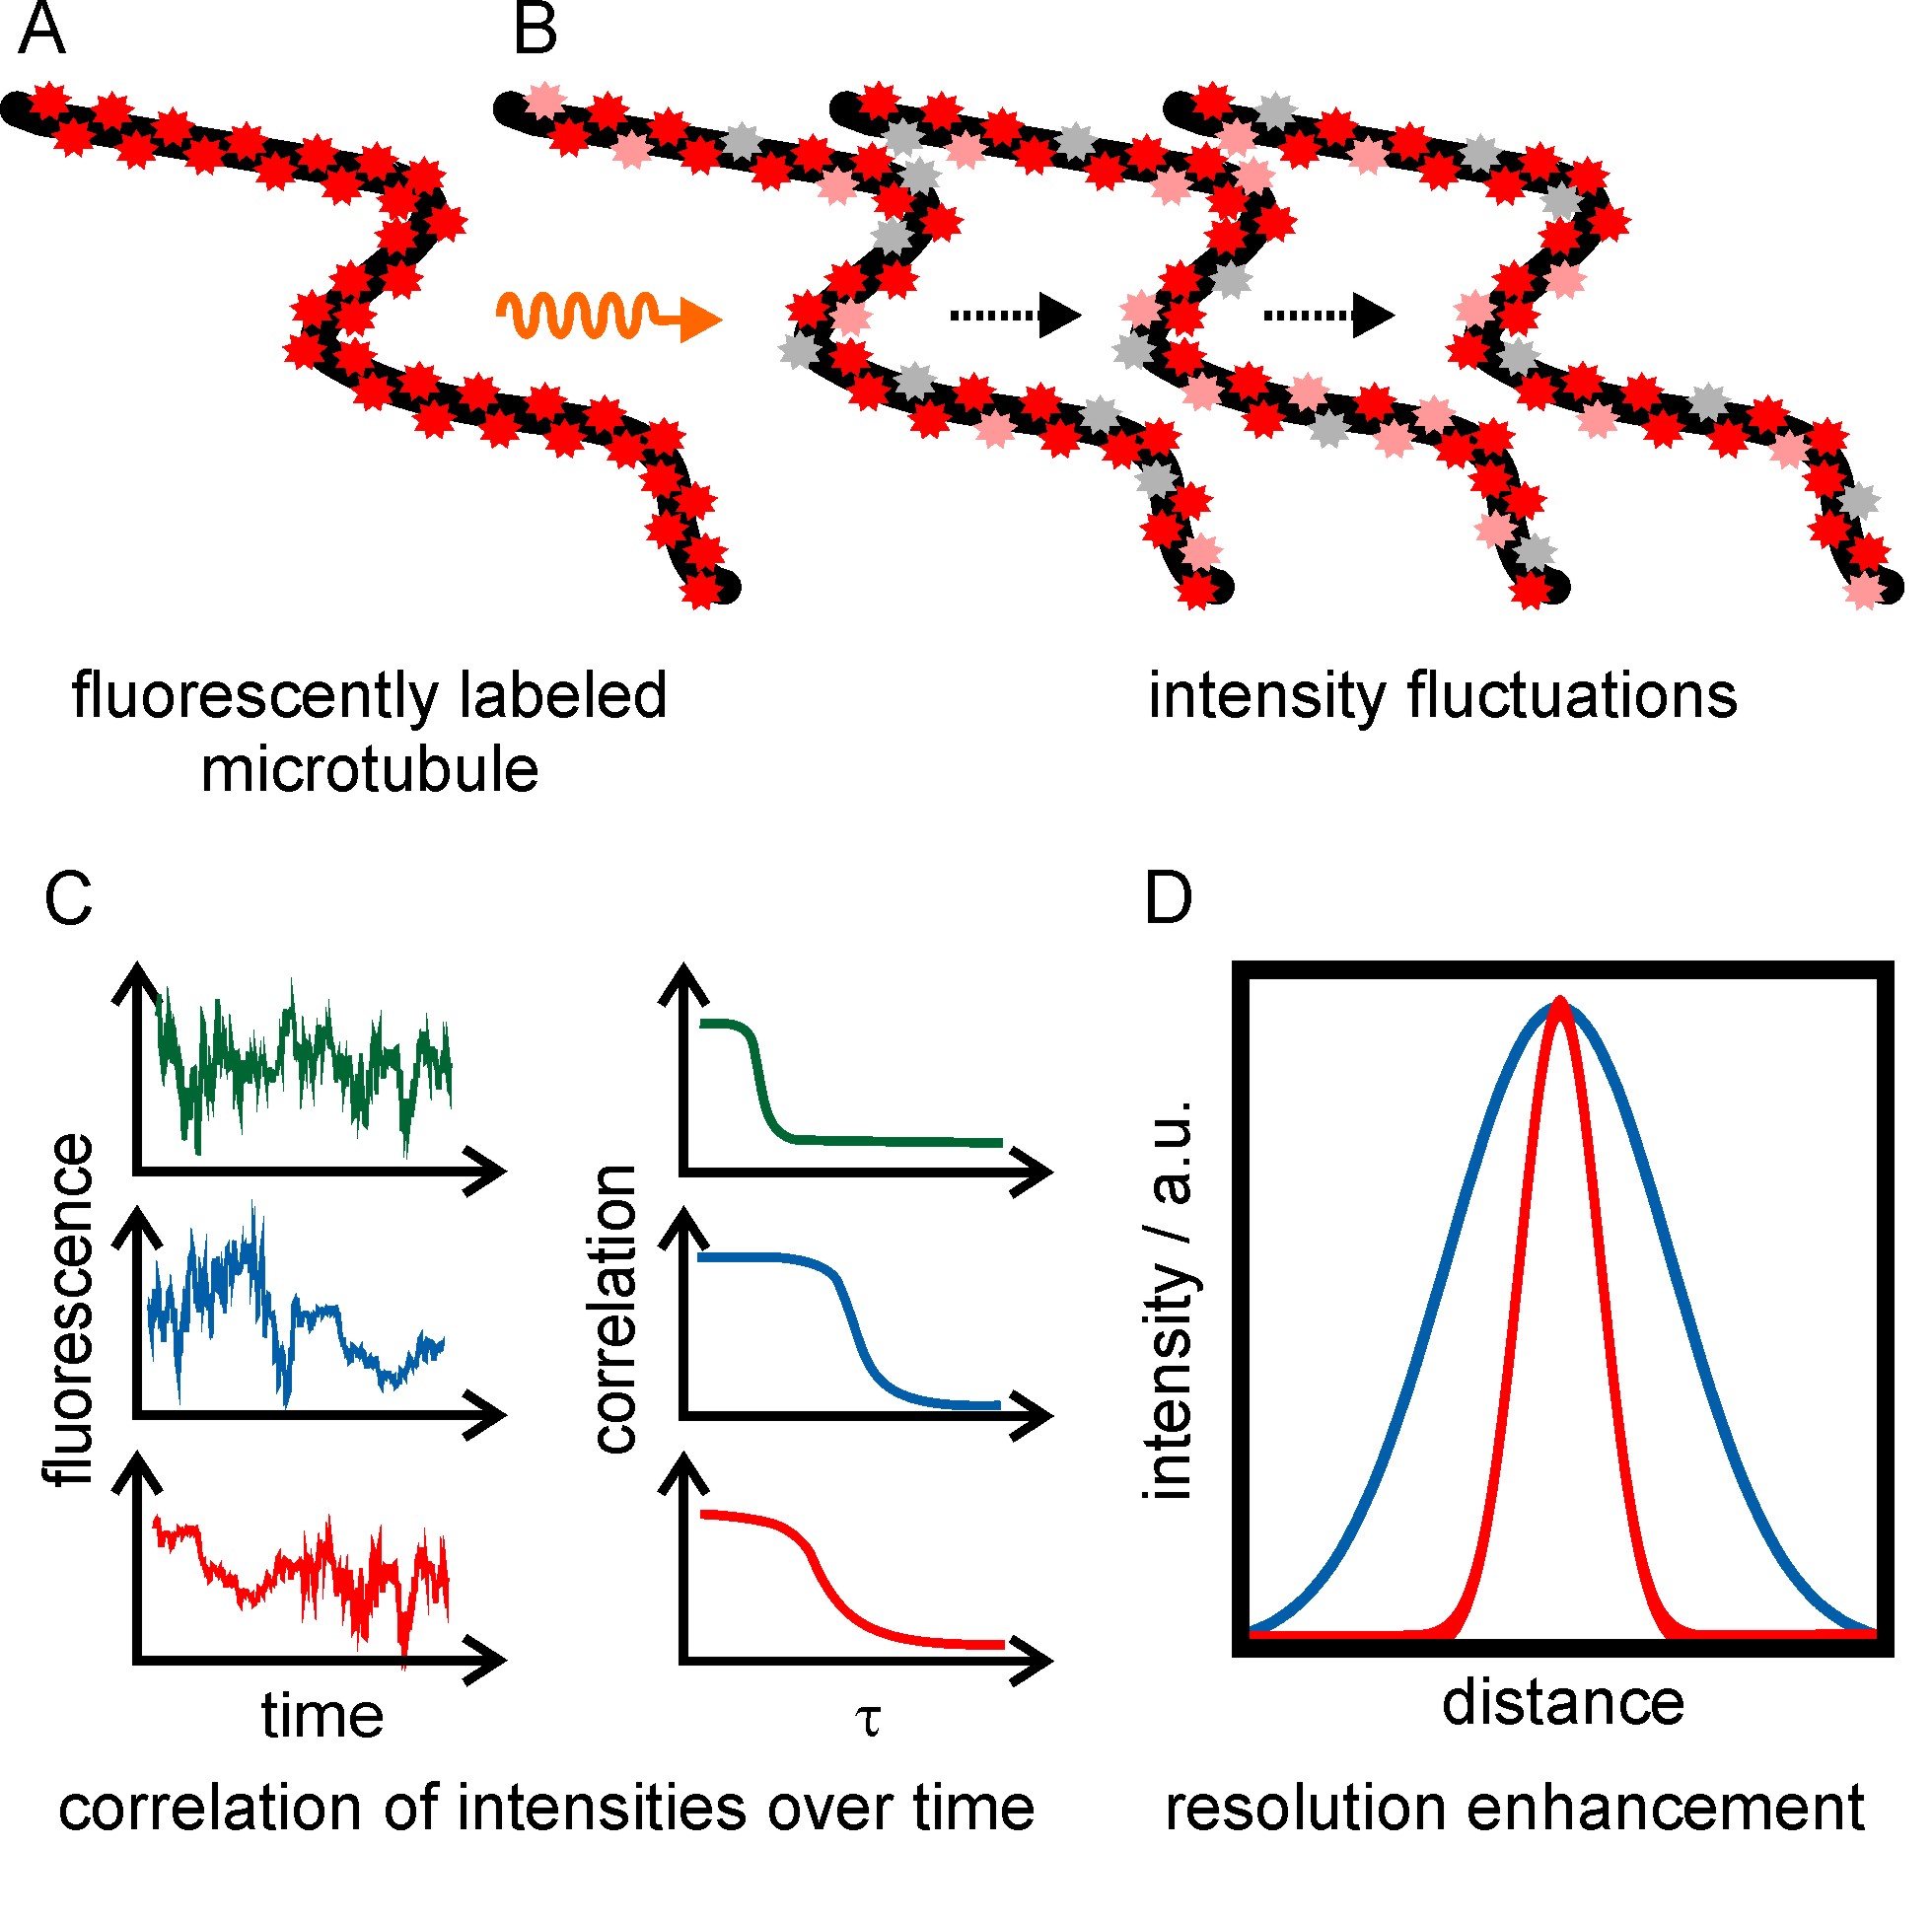
Figure 6: Principle of super-resolution optical fluctuation imaging. (A, B) Fluorophore-labeled microtubules are irradiated with the appropriate wavelength to induce fluorescence intensity fluctuations and are recorded in an image series of about 1000 frames. (C) The intensity fluctuations over time are pixel-wise correlated. A super-resolved, background-free image is reconstructed. (D) Intensity plot showing the resolution enhancement of SOFI images (red) compared to wide-field microscopy (blue). For the nth order correlation a resolution enhancement of factor √n can be achieved.
Confocal laser scanning microscopy
Compared to conventional wide-field microscopy where the whole sample is illuminated and imaged at once, confocal laser scanning microscopy (CLSM) is an approach, where a laser focus is moved through the sample while the fluorescence intensity is recorded. By using a pinhole, fluorescence emission from out-of-focus planes is eliminated and the contrast is enhanced. By knowing the position of the laser focus and the respective recorded intensity, a confocal image can be reconstructed (figure 7).
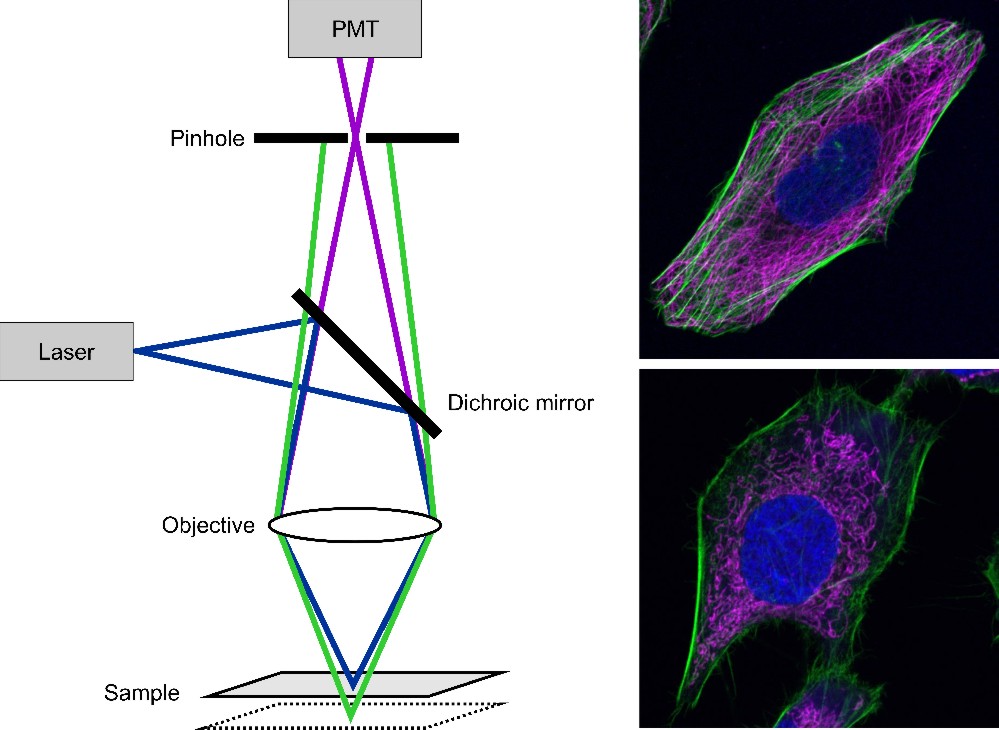
Figure 7: Scheme of a confocal laser scanning microscopy (left). The laser light is focused on the sample. The fluorescence passes the dichroic mirror and is detected by a photomultiplier (PMT). Out-of-focus light is eliminated by a pinhole. By scanning the sample an image is generated. On the right two CLSM images are shown. The upper one shows an U2OS cell with its nucleus stained with DAPI (blue), the actin filaments labeled with Alexa Fluor® 488 phalloidin (green) and microtubules immunolabeled with Alexa Fluor® 647 (magenta). The lower image shows a HeLa cell with actin labeled with Alexa Fluor® 488 phalloidin (green), mitochondria stained with MitoTracker® Orange (magenta) and the nucleus labeled with DRAQ5 (blue).
Quantum dot triexciton imaging
Quantum dots have unique optical properties: next to their brightness and photostability, the absorption of multiple photons and the generation of multiple excited states ("excitons") is possible. A three-photon absorption process can and the spectrally-separated detection of the recombination can be exploited to achieve a ~2-fold increase in spatial resolution in 3D. This technique is called quantum dot triexciton imaging (QDTI) (figure 8). Remarkably (and different to conventional multi-photon microscopy), this approach can operate with continuous-wave laser sources and thus be realized on any ordinary confocal microscope. As a pure physical approach is compatible to any nanoenvironment, and e.g. can be applied in live cells.
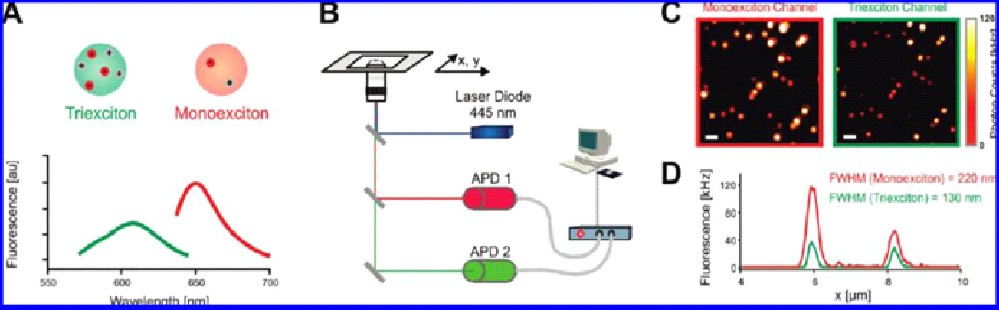
Figure 8: Principle of quantum dot triexciton imaging. (A) Three-photon absorption leads to a fluorescence emission shift to lower wavelength. (B) Experimental setup consisting of two APDs for parallel two color imaging for ‘normal’ fluorescence emission and the triexciton detection. (C) A clear resolution enhancement in the triexciton channel is observed. (D) The intensity profiles of two emitters show the reduced full width at half maximum (FWHM) in the case of triexciton.
Förster resonance energy transfer
Förster resonance energy transfer (FRET) is a technique to measure distances of a few nanometers between two fluorescent molecules. A donor fluorophore that is excited by a laser transfers a part of its energy non-radiatively to an acceptor fluorophore. The transfer efficiency is dependent on the inter-fluorophore distance. Detecting the emission of the donor and acceptor fluorophore separately allows calculation of the FRET efficiency and therefore the distance between the fluorophores (figure 9). Hence, FRET is an ideal tool to probe intramolecular conformational changes at the nanometer scale as well as inter- and intramolecular interactions.
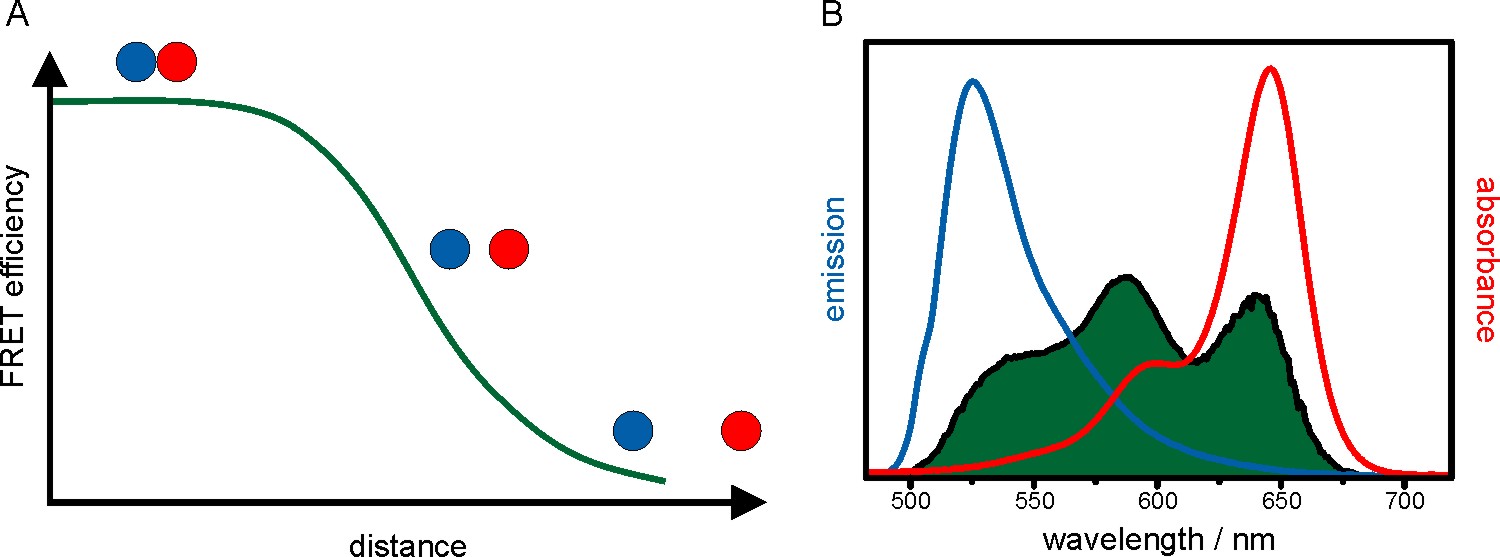
Figure 9: Fluorescence resonance energy transfer. (A) FRET efficiency as a function of the distance between donor (blue) and acceptor (red) fluorophore. With increasing interfluorophore distance the FRET efficiency decreases. (B) Furthermore, the donor’s emission spectrum (blue) has to overlap with the acceptor’s absorption spectrum in a large area which is mathematically described by the overlap integral (green).
Conventional FRET measurements are carried out at high concentration at the ensemble level, such that the observed FRET efficiency represents an average value. By observing single events, single-molecule FRET (smFRET) can resolve the heterogeneity in a sample: subpopulations can be revealed, and experiments can be carried out without the need of (temporal) synchronization. smFRET further provides information on association and dissociation kinetics and on binding constants. In combination with an alternating excitation scheme for the acceptor fluorophore (e.g. in alternating-laser excitation (ALEX), or pulsed-interleaved excitation (PIE)), it further becomes possible to determine the stoichiometry of molecular complexes.
Equipment
Two custom-built microscopes for single-molecule super-resolution microscopy
The first setup is equipped with a Coherent Innova70C multi-line argon krypton laser (with the main emission lines at 458 nm, 476 nm, 488 nm, 514 nm, 531 nm, 568 nm, 647 nm) and a solid state UV laser (405 nm). It is further equipped with two detection channels as well as 3D optics for 3D super-resolution imaging. The second setup is equipped with solid state lasers (405 nm, 488 nm, 532 nm, 568 nm, 647 nm) and a dual-channel detection scheme. Both systems can be operated in different illumination schemes: wide-field, highly inclined and laminated optical sheet (HILO) or TIR configuration.
N-STORM (Nikon, Düsseldorf, Deutschland)
Custom-built TIRF setup for single-molecule FRET
The microscope is equipped with two solid state lasers (532 nm, 637 nm) and a sensitive EMCCD camera.
Custom-built confocal setup for FCS
The setup for fluorescence correlation spectroscopy is equipped with two solid state lasers (532 nm, 640 nm) and two avalanche photodiodes (APDs), and allows for both auto- as well as cross-correlation.
Confocal laser scanning microscope LSM 710 (Zeiss, Jena, Germany)
The CLSM is equipped with an argon laser (458 nm, 488 nm, 514 nm), two gas lasers (543 nm and 633 nm) and a diode laser (405 nm). It is equipped with an integrated heating stage. The system is capable of confocal imaging in 2D and 3D (three detector channels), live cell imaging, FRAP, photoconversion and FRET.
Fluorescence correlation spectrometer ConfoCor2 (Zeiss, Jena, Germany)
The ConfoCor2 has an argon laser (458 nm, 488 nm, 514 nm) and two HeNe lasers (543 nm, 633 nm). Two photodiodes (APDs) allow two-color cross-correlation.
UV-Vis spectrophotometer Cary 100 (Agilent Technologies, Santa Clara, California)
The Cary100 spectrophotometer measures absorption spectra in a wavelength range from 190 nm – 900 nm.
Fluorescence spectrophotometer Cary Eclipse (Agilent Technologies, Santa Clara, California)
The CaryEclipse spectrophotometer is able to collect emission as well as excitation spectra and covers a wavelength range from 190 nm – 1100 nm.
NanoPhotometer® (Implen GmbH, München, Germany)
Spectrophotometer for small volumes (down to 0.3 µL) as well as cuvettes. Scan capability from 200 nm – 950 nm.
Biological sample preparation
Techniques
- Cell culture
- Cloning
- Transformation/Transfection
- Protein expression and purification
- SDS-PAGE and agarose gel
- Labeling of proteins and DNA with fluorophores
- UV/Vis and fluorescence spectroscopy, anisotropy
Labeling strategies
There is a huge toolbox available to specifically label proteins, nucleic acids, lipids as well as carbohydrates. The following section summarizes some of the labeling strategies used in the group.
Immunofluorescence
A standard procedure is immunolabeling using antibodies against the target molecule. Direct immunofluorescence uses a fluorophore labeled primary antibody directed against the molecule of interest. In the case of indirect immunofluorescence, a primary antibody binds to the target molecule and is detected by a secondary antibody labeled with an organic dye.
Conjugation to functional groups
Proteins can be directly coupled to an organic dye at specific amino acids, e.g. at amine groups (N-terminal amine or ε-amino group of lysine) via N-hydroxysuccinimide (NHS) ester coupling or at the thiol group of cysteine with maleimide-functionalized dyes.
Fusion proteins
Proteins also can directly be linked to a fluorescent protein. In this case the gene sequence of a fluorescent protein is fused to the gene of interest. The fusion protein is then expressed within the cell and live cell imaging is possible.
Chemical tags
Chemical tags like the SNAP- and Halo-tag use a marker protein fused to the protein of interest which then binds a fluorescent tag possessing a reactive group (e.g. O6-benzylguanine derivatives or chloroalkane conjugates).
DNA stains
Established DNA labeling procedures use intercalators, e.g. ethidium bromide which incorporates between base pairs of the DNA, or minor groove binders, e.g. DAPI. Click chemistry offers a powerful alternative for labelling nucleic acids. Here, a modified nucleoside exhibiting an alkyne group (e.g. ethinidyl-dU, EdU) is added to the growth medium of proliferating cells, and the nucleoside is incorporated in newly synthesized DNA. Via a copper(I)-catalyzed reaction an organic dye functionalized with an azide group is coupled to the modified nucleoside, and allows high-density labelling of DNA with virtually any fluorophore.
Equipment
- Plasmacleaner Zepto (Diener electronic): Cleaning of devices (e.g. glass surfaces for single-molecule microscopy) and plasma activation of plastic parts (e.g. for preparation of microfluidic devices).
- Savant SpeedVac® Concentrator SPD111V (Thermo Scientific): Standard evaporation of solvents and aqueous solutions.
- Spincoater (custom-built): Uniform distribution of molecules on a glass surface.
- PCR machine C1000 Touch Thermal Cycler (Bio-Rad)
- Gel Imaging System (Intas Science Imaging)
- Transmission light microscope (Nikon Eclipse TS100)
- Incubator
- Sterile benches
- Autoclave
- Centrifuges
- Electrophoresis systems (DNA and protein electrophoresis)