


Generation of a digital global map of artificially drained agricultural areas
Artificial drainage of agricultural land, for example with ditches or drainage tubes, is used to avoid water logging and to manage high groundwater tables. In semi-arid and arid regions, drainage of irrigated lands helps to reduce the risk of salinization and is thus, for many soils, a prerequisite for sustainable land use. In humid regions, drainage helps to extend the period in which the field can be entered with heavy machines. Artificial drainage decreases the average water content of the subsoil and accelerates the transport of water through the soil. Therefore, it influences nutrient transport by increasing leaching losses and by decreasing denitrification. Although multiple impacts of artificial drainage exist there is no global map of areas with artificially drained agricultural areas.
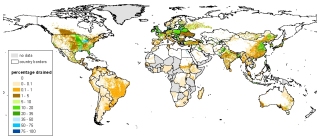
Here we present a first indicative map that provides the fraction of each 5 arc min by 5 arc min cell area that is equipped for improved drainage. The map is mainly based on:
-
national statistics provided by international organizations (e.g. FAO, ICID, CEMAGREF)
-
the “Global Croplands Dataset” (Ramankutty et al., 1998) and
-
the “Digital Global Map of Irrigation Areas” (Siebert et al., 2005).
Due to the spatial resolution of the data sources we recommend to use the map of artificially drained areas only for continental or global scale assessments. No data on agricultural drainage could be found for 120 countries. Most of them are very small so that their agricultural drainage area maybe neglected in global assessments. However, there are also some larger countries (in particular in Africa) where it is known that artificially drained areas are existing but the extent of these areas is unknown (e.g. Mali, Niger, Chad, Mozambique). Therefore the real global extent of agricultural drainage maybe underestimated in this inventory.
map previews: download raster map as pdf-file [0.3 MB] or download vector map as pdf-file [2.9 MB]
Documentation
The map generation method as well as data sources, results and limitations are described in Frankfurt Hydrology Paper 4 (Feick et al., 2005).
[Download documentation, 1.7 MB]
Download of the data set
The data set can be downloaded for non-commercial use. The data set is distributed as ascii-grid with the following characteristics:
| Projection: | Geographic |
| Number of columns: | 4320 |
| Number of rows: | 2160 |
| North Bounding Coordinate: | 90 degrees |
| East Bounding Coordinate: | 180 degrees |
| South Bounding Coordinate: | -90 degrees |
| West Bounding Coordinate: | -180 degrees |
| Cellsize: | 5 minutes, 0.083333 decimal degrees |
| NODATA value | -9 |
Data set 1: artificially drained agricultural area of each 5 arc min x 5 arc min grid cell in ha, [Download zip-archive, 2.9 MB]
Data set 2: fraction of each 5 arc min x 5 arc min grid cell that is artificially drained, [Download zip-archive, 2.8 MB]
We provide additionally three data sets that indicate the artificially drained agricultural area on irrigated land, on rainfed land and for the countries where the data did not allow to distinguish drainage of irrigated land and drainage of rainfed land. Summarizing of these three data sets yields the total drained agricultural area as presented above.
Data set 3: artificially drained irrigated land of each 5 arc min x 5 arc min grid cell in ha, [Download zip-archive, 1.3 MB]
Data set 4: artificially drained rainfed land of each 5 arc min x 5 arc min grid cell in ha, [Download zip-archive, 1.2 MB]
Data set 5: artificially drained area of each 5 arc min x 5 arc min grid cell for countries in which a dinstinction of drainage of irrigated areas and drainage of rainfed areas was not possible in ha, [Download zip-archive, 1.1 MB]
please note: Data set 3 + Data set 4 + Data set 5 = Data set 1
Data set 6: fraction of each 5 arc min x 5 arc min grid cell artificially drained and irrigated, [Download zip-archive, 1.3 MB]
Data set 7: fraction of each 5 arc min x 5 arc min grid cell artificially drained and rainfed, [Download zip-archive, 1.2 MB]
Data set 8: fraction of each 5 arc min x 5 arc min grid cell artificially drained for countries in which a dinstinction of drainage of irrigated areas and drainage of rainfed areas was not possible, [Download zip-archive, 1.0 MB]
please note: Data set 6 + Data set 7 + Data set 8 = Data set 2
Applications
The map will be applied, for example, to simulate terrestrial transport of nitrogen with the model WaterGAP-N (Siebert, 2005) which is an extension of the global model of water availability and water use WaterGAP 2.1 (Alcamo et al., 2003) or to simulate accelerated interflow on drained agricultural lands with the hydrological model WGHM (Döll et al., 2003).