


Bioinformatics Analysis of Hodgkin Lymphoma – a collaboration between pathologists and bioinformaticians
Hodgkin lymphoma (HL) and digital pathology
Hodgkin's disease is a type of lymphoma that is characterized by the occurrence of multinucleated Reed–Sternberg cells in tissue. The figure below shows a Reed-Sternberg cell within its micro-environment.
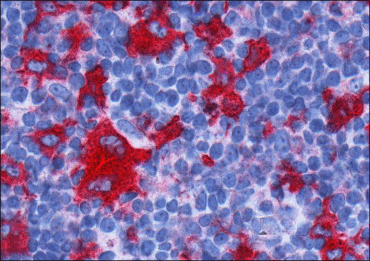
Figure 1: Typical CD30+ immunostained Reed-Sternberg cell within its microenvironment. Hematoxylin counterstaining is applied to visualize cell nuclei.
The treatment of the disease has been improving over the last years and patients with a favorable prognosis have a 5-year survival rate above 98%. Crucial for the treatment of patients is the determination of prognostic factors such as stage and histological subtype (e.g., mixed-cellularity or lymphocyte-depleted). The determination of many prognostic factors requires the visual inspection of stained histological tissue slides by expert pathologists. Therefore, the recording of high-resolution digital images has become part of daily work in pathological labs and databases of digital images of HL are growing. The images in these databases contain information on the spatial distribution, morphology, and immuno-histochemical features of malignant cells. Our project aims to explore the rich information content hidden in the image database of HL by the extraction of relevant statistical information for cases of different subtypes, prognoses, stages, and progressing.
Image analysis
We analyze whole slide images (WSI) of lymph nodes. In collaboration with pathologists we implement a pipeline to automatically detect different cell types, to measure their relative distances, and to compute morphological features, such as size and shape of the cells. The automatic analysis makes extreme demands on computer processing power and memory. Since in Hodgkin lymphoma the malignant cells are usually rare and make up only about 1% of the tumor mass we pre-process the images by a pixel classification in order to narrow down the region of interest.
Pixel classification
Using pixel classification distinguishes different image sections. The classification assigns each pixel either to cancer cell tissue, nuclei, background, or other types.

Figure 2: Example of pixel classification. Image A shows an input image region containing CD30+ cells. Image B shows the classification of pixel for image A. In image B, the color of a pixel indicates the tissue it was assigned to.
Project members
Senckenberg Institute of Pathology, Goethe University
Hansmann’s Group
Claudia Döring
Martin-Leo Hansmann
Sylvia Hartmann
Molecular Bioinformatics, Goethe University
Koch’s group
Jörg Ackermann
Norbert Dichter
Ina Koch
Hendrik Schäfer
Tim Schäfer
Jennifer Scheidel